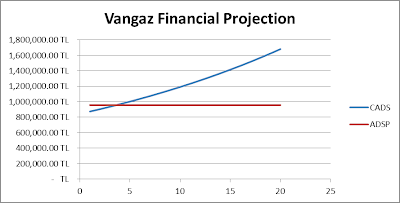
Analysis Methodology: It is worth to mention that, during the deregulation process and auctions were held, other than AKSA Energy Co., the other companies were not public companies and financial tables are not published. Therefore, due to the sensitivity of financial information, it is not possible to get most of the financial figures for these companies. We have rather data such as investment amount, Natural Gas usage, connection fee, USDC (Unit Service and Depreciation Charge) , connected consumers (including households, commercial and industrial users), cost of Natural Gas to the distributor company. In that sense, our main focus if to determine what would be the NPV of the investment for any distributor company that won the auction in its region. Namely, we will be calculating the ADSP (Annual Debt Service Payment) and CADS (Cash Available for Debt Service) figures with regard to investment amount and find out the total value of the distribution network and market in one of the regions, under normal circumstances, and then will focus on extraordinary circumstances that exceed general understanding of the companies as profit seeking institutions.
Financial Analysis Under Normal Circumstances: To keep things simple, we have focused on a place where competitive bidding would be at a moderate level and there would be moderate level of increase in Natural Gas usage over time. For such a place, we have chosen the city called Van in the eastern part of the region. In this city, connection fee is at its normal level and USDC amount is at its most profitable level for the distributor company and investment is also moderate with regard to the proportion of the city in that of Turkey.
Cost of Gas (TL/M3) | SPT (TL/M3) | USDC (TL/M3) | ||
0.505 | 0.023 | 0.05688 | ||
VAT (18%) | Total Gas Price (TL/M3) | Connection Fee (TL/M3) | ||
0.100728 | 0.685608 | 180 | ||
Customers | NG usage M3 | Investment (TL) | ||
5,073 | 16,177,421 | 13,156,094 | ||
Conn Rev (TL) | Maintenance Fee (TL/M3) | |||
913,140 | 0.002844 | |||
For this region, the distributor company is called AKSA Vangaz Corporation, one of the biggest one in the sector. For this company, when we assume that all the investment is borrowed from a national bank at an interest rate of 6% with a period of 25 years, Natural Gas usage will increase 3.5% annually and 5% of USDC will be spent as maintenance fee, we will be doing our financial projection for CADS and ADSP.
In terms of CADS calculations, we multiply Natural Gas usage volume by the amount of USDC minus Maintenance Fee. In terms of ADSP calculations, we assume that Connection Fee will lower the cost of investment in the beginning of the project and then we can calculate total investment cost. Then, ADSP and USDC for the first year will be;
CADS = 16,177,421 * (0.05688 - 0.002844) = 874,163.12, and this figure will increase every year with the increased usage.
ADSP = (13,156,094 - 913,140) x (.06/(1-(1/(1+.06)^25))) = 957,726.11
In the table below, we can see such a financial projection for loan amount TL 12,242,954:
Year | CADS | ADSP | Difference |
1 | 874,163.12 | 957,726.11 | (83,562.99) |
2 | 904,758.83 | 957,726.11 | (52,967.28) |
3 | 936,425.39 | 957,726.11 | (21,300.72) |
4 | 969,200.28 | 957,726.11 | 11,474.17 |
5 | 1,003,122.29 | 957,726.11 | 45,396.18 |
6 | 1,038,231.57 | 957,726.11 | 80,505.46 |
7 | 1,074,569.67 | 957,726.11 | 116,843.56 |
8 | 1,112,179.61 | 957,726.11 | 154,453.50 |
9 | 1,151,105.90 | 957,726.11 | 193,379.79 |
10 | 1,191,394.60 | 957,726.11 | 233,668.49 |
11 | 1,233,093.42 | 957,726.11 | 275,367.30 |
12 | 1,276,251.68 | 957,726.11 | 318,525.57 |
13 | 1,320,920.49 | 957,726.11 | 363,194.38 |
14 | 1,367,152.71 | 957,726.11 | 409,426.60 |
15 | 1,415,003.06 | 957,726.11 | 457,276.94 |
16 | 1,464,528.16 | 957,726.11 | 506,802.05 |
17 | 1,515,786.65 | 957,726.11 | 558,060.54 |
18 | 1,568,839.18 | 957,726.11 | 611,113.07 |
19 | 1,623,748.55 | 957,726.11 | 666,022.44 |
20 | 1,680,579.75 | 957,726.11 | 722,853.64 |
21 | 1,718,807.64 | 957,726.11 | 761,081.53 |
22 | 1,778,965.91 | 957,726.11 | 821,239.79 |
23 | 1,841,229.71 | 957,726.11 | 883,503.60 |
24 | 1,905,672.75 | 957,726.11 | 947,946.64 |
25 | 1,972,371.30 | 957,726.11 | 1,014,645.19 |
From the Table 1 it is obvious that, even if the company borrows the whole amount from a bank, in the first 3 years they will not be able to maintain the cash flow, unless they put Equity Capital in it to support the cost. However, this will be costly for the company since they will still subsidize the whole investment without making any penny. In that sense, if the company over borrows and puts it into an escrow account to subsidize the first few years’ lost, then it will make sense in terms of financial projection. In that sense, when we recalculate the required amount of loan, it turns out to be TL 12,455,963 that is 213,009 higher than the previous amount, and the new projection will look like this:
CADS | ADSP | Difference | Escrow Pays | |
1 | 874,163.12 | 974,389.10 | (100,225.98) | (100,225.98) |
2 | 904,758.83 | 974,389.10 | (69,630.27) | (69,630.27) |
3 | 936,425.39 | 974,389.10 | (37,963.71) | (37,963.71) |
4 | 969,200.28 | 974,389.10 | (5,188.82) | (5,188.82) |
5 | 1,003,122.29 | 974,389.10 | 28,733.19 | - |
6 | 1,038,231.57 | 974,389.10 | 63,842.47 | - |
… | … | … | … | … |
Under new circumstances, in the first 4 years, the company will pay the excess of ADSP over CADS from the escrow account and will start to make money thereafter. That is, first 4 years’ difference will be equal to the escrow account; 100,225 + 69,630 + 37,963 + 5,188 = 213,009.
