Wednesday, July 31, 2013

Energy Intensity rate of Natural Gas Fired Power Plants in Turkey


Sustainable Development has three pillars, as the literature says; Social, Economic, and Environment ones (1). Therefore, maintaining sustainable development has always been part of Economic agenda of countries in order to create realistic welfare for its citizens. Yet, economic development is totally dependent on the natural resources that are transformed to produce goods. In that sense, the most important inputs as natural resource are energy ones. That all being said, in this blog I am going to analyze how energy intensity rate of natural gas fired plants on both resource and economic base are tied to economic development data in Turkey.

Turkey has started to meet its electricity need from Natural Gas starting from 1985 at a growing rate, and as of 2011 installed capacity ratio of Natural Gas fired plants to total is 48.47%, while ratio of electricity supplied from these plants to total amounts to 45.36%. With these high ratios, analyzing energy intensity rate of these power plants would make sense in order to get a sip of sustainable development projections in Turkey. 


Source: TEİAŞ (Turkish Electricity Transmission Co.), www.teias.gov.tr

With regard to these graphs, important data that we will focus on later is as follows;


Year
Installed Capacity
Production
2005
7.66%
7.47%
2006
6.46%
8.86%
2007
-0.87%
8.65%
2008
-4.86%
3.58%
2009
6.49%
-1.82%
2010
11.37%
8.42%
2011
0.62%
8.61%


At this point, focusing on energy intensities of these power plants on resource base, which is natural gas, will let us contemplate how efficiently these plants are functioning. When we analyze natural gas use in cubic meters in electricity sector with regard to total electricity produced in GWh from natural gas, resource based energy intensity ratio will look as in the following graph;


Data Source: Energy Balance Tables, ETKB (Ministry of Energy and Natural Resources), www.enerji.gov.tr
 
By using average energy intensity ratio, one can easily calculate how much natural gas will be used by one power plant on average as long as projected production is given for that plan in a year. Yet, while such an intensity ratio makes sense investment and financial wise for a corporation, tying this resource based energy intensity to Economic agenda is the crucial one. That is to say, when we can adapt such an intensity measure to GDP development and further to GDP per capita in Turkey, we will be able to recommend policies in energy sector to maintain sustainable development. In that sense, what we do here is to compare these figures with economic data, mainly GDP per capita with current USD. The following graph shows the relationship between the two:


Data Source: World Bank databank.worldbank.org
 
What is striking here is that the correlation of resource based energy intensity with regard to GDP (Current USD) per Capita goes on a line from 2005 to 2011, except years 2009 and 2010! What makes these two outlier years is that there had been economic contraction in 2009 with a ratio of -4.83%. That is why, contemplating -4.83% GDP decrease for the former one and 9.16% increase for the latter one, crisis year 2009 and post-crisis year 2010 have been outliers. Once we eliminate these crisis-related years from the analysis, the picture becomes obvious; as the welfare increases for the citizens in terms of GDP per Capita, energy intensity for Natural Gas fired plants increase on a straight line. That should attract those who deal with economic agenda since more of natural resource will be consumed to maintain sustainable development.
Now it is time to conclude these data analyses and bring up some policy recommendations:
  • During a crisis year, energy intensity of NG fired plants increases, which means efficiency of the plants is lowered. In that sense, although crisis cannot be eliminated and thus inefficiency for plants, one can at least closely monitor post-crisis period when there can happen a boom in order to curb energy intensity for some efficiency gains.
  • When we look at the data that show the change in both Installed capacity and Electricity produced, this is the conclusion;
o   When ∆ Production < ∆ Installed Capacity, energy intensity increases and thus efficiency decreases – 2009 & 2010 cases
o   When ∆ Installed Capacity < ∆ Production, energy intensity decreases and thus efficiency increases – 2005, 2006, 2007, 2008 & 2011 cases
Simply said:


∆ P > ∆ IC
∆ P < ∆ IC
Energy Intensity
  
Therefore, authorities should make sure that electricity production by NG fired plants is tied to investment in capacity so as to gain efficiency.
  • In order to maintain sustainable development, innovation and efficiency for these power plants are of utmost importance in such a country with resource constraints as Turkey, which is energy dependent one. Therefore, policy tools to encourage efficiency in these plants as economic development takes place will curb energy intensity and thus current deficit, and will pave the way for economic welfare without monetary stress for these resources. To further understand this issue, the following illustration will better explain it graphically:


After year 2011, we assume that 16,000 USD/Capita welfare standard will be achieved in another 6-7 years. In business as usual scenario, correlation of energy intensity and GDP/capita will walk on the straight line and more energy will be needed to achieve higher standard of welfare. At the end, on welfare point 16,000 USD/Capita, around 0.000226 Billion m3 of Natural Gas should be consumed to produce 1 GWh of Energy under base scenario. However, when incentive programs are applied in two successive periods to improve efficiency, around 0.000223 Billion m3 of Natural Gas should be consumed to produce 1 GWh of Energy. Thus, less of total energy will be consumed in successive years.

Friday, April 5, 2013

Ease of pulling weather data online by using Python for Energy Consumption Pattern Analysis and Demand Forecasting


Ease of pulling weather data online by using Python for Energy Consumption Pattern Analysis and Demand Forecasting  

Energy demand forecasting is part of process optimization in terms of daily capacity reservation and programming daily purchase of energy resource, stabilizing the stress on the lines, diversifying resources and lowering their cost with regard to spot and future markets, and planning future investments. In that sense, forecasting becomes crucial part of managing the company to survive in the sector through peak times or times when resources are constrained. 

Especially, during winter times, when the need for heating is high, residential heating peaks. Energy management and projection of daily demand, even hourly, would put much strain on financial and operational sides of any company ranging from wholesaler and distribution ones to power producer plants; such as the risk of falling into spot market, factored network operations charges due to wrong planning of supply, losing money on take-or-pay agreements in the long run and so on. Therefore, a methodology has been built up by the forecasters and statisticians regarding different type of segments including mainly households, industrial users and power producers. 

Since this topic is related to space heating during winter times, residential consumers are of focus in this analysis. In residential heating, energy consumption depends on the factors mainly as outside temperature, the isolation of buildings, energy efficiency of boilers/ACs, price, income, etc. Among all, outside temperature will mostly determine the energy consumed. Whenever the temperature is out of comfort range, meaning 18 0­ C – 22 0­ C, energy is consumed to heat up or cool down the room space. As the actual temperature diverges from one of these threshold temperatures, energy need for households increases. That being said, "Heating degree days", or "HDD", are a measure of how much (in degrees), and for how long (in days), outside air temperature was lower than a specific "base temperature" (or "balance point"). For example, for one day, if the outside temperature was 14 0­ C, then the HDD would be 18 – 14 = 4. In that sense, as HDD increases, the heating need for space, eventually energy consumption, would increase, as well. Specifically, when we talk about natural gas consumption by boilers, in general, energy need per subscriber would look like as in the following graph: 


* Numbers for energy consumption / subscriber are arbitrary

Yet, when we analyze energy consumption data by using Eviews, we would treat data in time series format in seasons; winter period, spring period, summer period. Each period has its own consumer behavior model with regard to energy consumption pattern. In that sense, daily Natural Gas consumption data analysis is done as such; retrieve the temperature data for each day, then convert to HDD, and then match and compare the total energy consumed per subscriber with the relevant HDD data by running regression tool.

On Eviews, energy consumption regression graph would look like the following one:


This graph shows us how total energy consumption per subscriber in one day changes with regard to HDD of that day. Using the formula derived from this regression of energy and temperature data, companies can estimate the energy need by residents with regard to HDD vaue of coming days. 

Regarding the data needed to create time series and then run a regression, Energy companies can track energy consumption and subscriber data, yet tracking temperature data is difficult, and even some meteorological observatory institutions would ask for a fee to provide such a service. On the other hand, jotting down numbers from websites would take time, as well. At this point, a software called as Python would step in to bring digital data to your computer from the web. Python, as a programming language, needs codes to get the orders and serve you as an agent to capture the data. Since I am not a programmer, I would not talk about the coding procedure, yet I will give you the overall picture. First, one should have installed the relevant programs:

-          Install Python 2.7.3
-          Then install Spyder 2.1.11
-          Then install xlwt-0.7.3
*Warning: If you run on 64 bit computer, you may need different versions for these programs. 

Here, “xlwt” is a program to create excel files; as Python captures data with regard to the codes you entered, they will be formatted as excel files. Besides, the codes you entered to python file can be edited through IDLE. Regarding the temperature data, a format has been already placed on web so that Python will recognize the data format and create excel sheets as the process of capturing data starts. At this point, a website called as www.weatherunderground.com steps in. This website is highly popular one among those who are keeping an eye on weather conditions and compatible with Python users. The compatibility issue is a matter of formatting the data on websites as “json” files. On this website, max and min temperature data, wind direction and magnitude data, along with comments and other data are formatted as json files so that Python reads the data and brings them to your computer to format in an excel file. In that sense, for any province or city, one can find meteorological data in json format. Then, it is part of your programming skill to write the codes to capture historical temperature data or 10 days of forecast. Below is part of the code that is written to capture historical data for Muğla, a western city of Turkey. 


Likewise, the website also has daily json files for 10 days of forecast so that energy companies can forecast the related energy need change with regard to temperature forecast in any city. On excel sheet, the forecast data will look like as such: 


As you create your model on Excel, you can easily link your forecasting formula with the name of excel files you create each day by running the software. In conclusion, one leg (temperature data) of tri-pod (energy consumed, subscribers, temperature) on which residential energy consumption pattern analysis is mounted would also be digitally available in an easier format.

Thursday, March 22, 2012

Financial Alternatives for Green House Projects

When greening a house, what comes to mind is mostly renewable energy installations, particularly solar and wind power. Yet, renewable energy equipment installations will meet most of the power need of the house, but not all of it. There will be some power need left that would be met by the conventional grid. The reason behind not fully meeting the power need by the renewable power is to prevent the waste of the excess power generated from such equipments. When the goal of the project “Greening the House” is to green the power consumed by the house 100%, the rest of the power should also be greened.

In order to green the power consumed by the households, there has long been initiatives at state and federal level to support the renewable energy installations. Renewable Energy Credits have been one of the tools to green the power. Another method came from the private sector in that the utility companies charged a premium to their customers’s bills when asked for green power from renewable energy. Along with the deregulation, the market has started to become competitive in terms of both power sales and green marketing.  Regarding these issues, there are 3 financial alternatives for a household to green its power consumed at home in the traditional marketplace.

1-    Green Pricing

Under this option, power companies provide charges customers a small premium in exchange for electricity generated from clean energy sources. The premium charge varies from one utility to another and the market is still niche and not yet competitive. The premium charge varies from 2 cents/kWh to 6.5 cents/kWh. Yet, along with the deregulation, since the customers have option of choosing their own utility provider, the power generator companies develops new marketing strategy to lock-in their customers by offering lower prices in exchange for a long-term contract. That is, this alternative lowers the risk but also removes the flexibility of the customer.

2-    Renewable Energy Credits (RECs)

Cap-and-trade system has put some pressure on the utility companies to meet national emission standards and the Renewable Energy Credits (RECs) generated by renewable energy generators and account for 1 REC/1MWh, such as solar and wind power, have been supplementary tools for such utilities to meet Renewable Portfolio Standards in various states. Each utility is required to hold some RECs at the end of the year in order to meet these standards so that they will have greened their traditional power generation. On the other hand, on residential sector, those households who want to green their power from the traditional grid can also by RECs in order both to support installation of renewable energy by Utility companies and to green their own power consumed at their houses.

3-    Competitive Pricing

Along with the deregulation in Energy sector, the households can choose their utility provider and thus the premium charged for green pricing. Such a deregulation creates a competition between utilities, and households have the flexibility of choosing the best alternatives in time. The difference between this option and the first option is that, this option provides free room for the households to be flexible but with a higher risk. Furthermore, this option is good for short-term solutions.

Assessment:

Now, we can compare all these 3 alternatives and give our recommendation to the sponsor to implement in the project:

Assumptions and facts:

-    There is no dynamic pricing
-    Seasonality affects green pricing premium charges
-    The utility companies to compare are:
   o    BGE – 13.2 cents/kWh – no green pricing
   o    Delaware Electric Cooperative – 11.22 cents/kWh – 4 cents/kWh premium
   o    Appalachian Power Co. – 10.36 cents/kWh – 5 cents/kWh premium
-    RECs are purchased after each 1 MWh of energy consumed
-    Households can choose utility company from another state if opting green pricing option
-    Households can choose utility provider only within the state if opting REC option
-    2010 energy consumption is 10011 kWh
-    REC prices used as base apply to every renewable energy generation, including Solar power

    1st Alternative:

    In Baltimore, according to the U.S. Department of Energy, there is not such a green pricing in Maryland. Therefore, the available option to the consumer is to choose utility provider from another state. When we applied this option to 2010 figures of our sponsor’s house, the result would look like this:
Delaware Electric Cooperative: (11.2 + 4) * 10011 * 0.01 = $1523.67
Appalachian Power Co. : (10.36 + 5) * 10011 * 0.01 = 1537.69

    2nd Alternative:

    The REC prices varies from state to state and therefore we choose average of them. The following $/MWh prices are the base for 2010. Also, depending on the assumption, the REC purchase months are also shown in the table:


Based on these figures and electricity prices charged by BGE, the result would look like this:
13.2 * 10011 * 0*01 + 183 = 1504.45

    3rd Alternative

    The 1st alternative brings the option of choosing the utility provider to minimize the cost, yet it mentions the long term contracts to bring down risk in exchange for lowered flexibility. If the household puts more stock on flexibility, then it can avoid long term contract at the expense of discounted green price premium. Depending on the assumptions of “no dynamic pricing” and “seasonality effect on green pricing premium charges”, the following table depicts the seasonal volatility on green pricing premium charges by Delaware and Appalachian Utilities.


Using the figures from energy consumption table of sponsor’s house, we can calculate the total cost of greening the house under competitive pricing;

Delaware Electric Cooperative: 0.01*(6*2509+3.5*2477+4*5025+11.22*10011) = 1561.47

AEP Appalachian Power: 0.01*(5.5*2509+4*2477+5*5025+10.36*10011) = 1525.46

Mixture to minimize Premium Charge Cost: 0.01*((10.36+5.5)*2509+(11.22+3.5)*2477+(11.22+4)*5025) = 1527.35

The Result:


Among all these alternatives, the lowest cost option seems to be the 2nd one, where the household will buy the power from traditional grid and buy RECs from the power generators in the market. However, this option would be the lowest desired one due to its high Risk and low Flexibility features. Our sponsor should not bear the cost of volatile REC market and lock-in problem by the utility provider. Furthermore, if we look at the market under current conditions where the REC prices spike to $40/MWh, this option has the risk of bringing unbearable costs in the future. On the other hand, the 1st option lowers the risk but it also lowers the flexibility. The thing to consider here is that, we are trying to green the house at minimum cost. The intonation here is not on minimum cost, rather is on the greening part. That is to say, if there would be a better option in the future to green the house, for instance due to grid parity of Solar Power generation, then we should have the Flexibility to do so. Therefore, the emphasis should be on the “Flexibility” to green the house in a reasonable way without getting locked-in and through estimating the future.

Sunday, February 26, 2012

Financial Analysis of Distributors in Turkish Natural Gas Market

Analysis Methodology: It is worth to mention that, during the deregulation process and auctions were held, other than AKSA Energy Co., the other companies were not public companies and financial tables are not published. Therefore, due to the sensitivity of financial information, it is not possible to get most of the financial figures for these companies. We have rather data such as investment amount, Natural Gas usage, connection fee, USDC (Unit Service and Depreciation Charge) , connected consumers (including households, commercial and industrial users), cost of Natural Gas to the distributor company. In that sense, our main focus if to determine what would be the NPV of the investment for any distributor company that won the auction in its region. Namely, we will be calculating the ADSP (Annual Debt Service Payment) and CADS (Cash Available for Debt Service) figures with regard to investment amount and find out the total value of the distribution network and market in one of the regions, under normal circumstances, and then will focus on extraordinary circumstances that exceed general understanding of the companies as profit seeking institutions. 

Financial Analysis Under Normal Circumstances: To keep things simple, we have focused on a place where competitive bidding would be at a moderate level and there would be moderate level of increase in Natural Gas usage over time. For such a place, we have chosen the city called Van in the eastern part of the region. In this city, connection fee is at its normal level and USDC amount is at its most profitable level for the distributor company and investment is also moderate with regard to the proportion of the city in that of Turkey.
 
Cost of Gas (TL/M3)
SPT
(TL/M3)
USDC (TL/M3)

0.505
0.023
0.05688

VAT
(18%)
Total Gas Price (TL/M3)
Connection Fee
(TL/M3)

0.100728
0.685608
180

Customers
NG usage M3
Investment (TL)
5,073
16,177,421
13,156,094
Conn Rev (TL)
Maintenance Fee (TL/M3)

913,140
0.002844


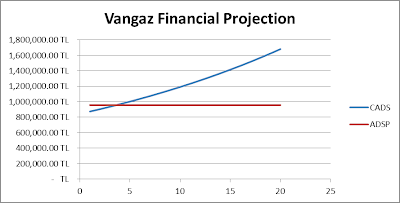
For this region, the distributor company is called AKSA Vangaz Corporation, one of the biggest one in the sector. For this company, when we assume that all the investment is borrowed from a national bank at an interest rate of 6% with a period of 25 years, Natural Gas usage will increase 3.5% annually and 5% of USDC will be spent as maintenance fee, we will be doing our financial projection for CADS and ADSP.
In terms of CADS calculations, we multiply Natural Gas usage volume by the amount of USDC minus Maintenance Fee. In terms of ADSP calculations, we assume that Connection Fee will lower the cost of investment in the beginning of the project and then we can calculate total investment cost. Then, ADSP and USDC for the first year will be;
CADS = 16,177,421 * (0.05688 - 0.002844) = 874,163.12, and this figure will increase every year with the increased usage.
ADSP = (13,156,094 - 913,140) x (.06/(1-(1/(1+.06)^25))) = 957,726.11
In the table below, we can see such a financial projection for loan amount TL 12,242,954:

Year
 CADS
 ADSP
Difference
1
 874,163.12
 957,726.11
 (83,562.99)
2
 904,758.83
 957,726.11
 (52,967.28)
3
 936,425.39
 957,726.11
 (21,300.72)
4
 969,200.28
 957,726.11
 11,474.17
5
 1,003,122.29
 957,726.11
 45,396.18
6
 1,038,231.57
 957,726.11
 80,505.46
7
 1,074,569.67
 957,726.11
 116,843.56
8
 1,112,179.61
 957,726.11
 154,453.50
9
 1,151,105.90
 957,726.11
 193,379.79
10
 1,191,394.60
 957,726.11
 233,668.49
11
 1,233,093.42
 957,726.11
 275,367.30
12
 1,276,251.68
 957,726.11
 318,525.57
13
 1,320,920.49
 957,726.11
 363,194.38
14
 1,367,152.71
 957,726.11
 409,426.60
15
 1,415,003.06
 957,726.11
 457,276.94
16
 1,464,528.16
 957,726.11
 506,802.05
17
 1,515,786.65
 957,726.11
 558,060.54
18
 1,568,839.18
 957,726.11
 611,113.07
19
 1,623,748.55
 957,726.11
 666,022.44
20
 1,680,579.75
 957,726.11
 722,853.64
21
1,718,807.64
957,726.11
761,081.53
22
1,778,965.91
957,726.11
821,239.79
23
1,841,229.71
957,726.11
883,503.60
24
1,905,672.75
957,726.11
947,946.64
25
1,972,371.30
957,726.11
1,014,645.19


From the Table 1 it is obvious that, even if the company borrows the whole amount from a bank, in the first 3 years they will not be able to maintain the cash flow, unless they put Equity Capital in it to support the cost. However, this will be costly for the company since they will still subsidize the whole investment without making any penny. In that sense, if the company over borrows and puts it into an escrow account to subsidize the first few years’ lost, then it will make sense in terms of financial projection. In that sense, when we recalculate the required amount of loan, it turns out to be TL 12,455,963 that is 213,009 higher than the previous amount, and the new projection will look like this:


 CADS
 ADSP
Difference
Escrow Pays
1
 874,163.12
 974,389.10
 (100,225.98)
 (100,225.98)
2
904,758.83
 974,389.10
 (69,630.27)
 (69,630.27)
3
936,425.39
974,389.10
 (37,963.71)
 (37,963.71)
4
969,200.28
974,389.10
 (5,188.82)
 (5,188.82)
5
 1,003,122.29
974,389.10
 28,733.19
 -  
6
 1,038,231.57
974,389.10
 63,842.47
 -  


Under new circumstances, in the first 4 years, the company will pay the excess of ADSP over CADS from the escrow account and will start to make money thereafter. That is, first 4 years’ difference will be equal to the escrow account; 100,225 + 69,630 + 37,963 + 5,188 = 213,009.